 Skip to content
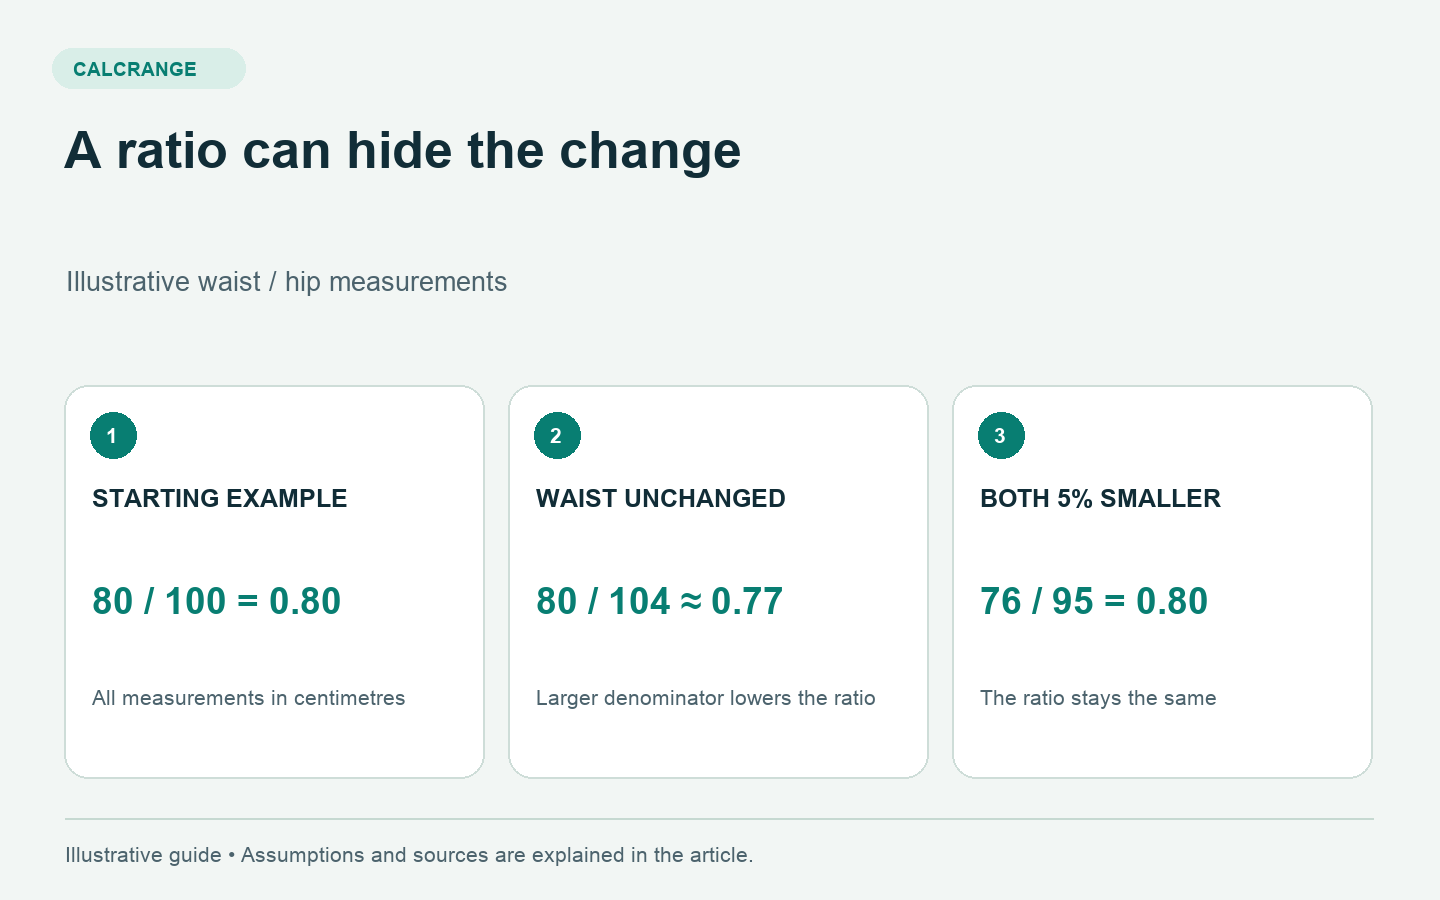
A lower waist-to-hip ratio does not automatically mean the waist became smaller. The ratio divides one measurement by another, so a change in either number can move the result. Looking only at the ratio can hide what happened.
Use the Waist-to-Hip Ratio Calculator with both measurements in the same unit. Save the waist and hip values alongside the ratio, especially when comparing measurements over time.
The arithmetic has two moving parts
Waist-to-hip ratio = waist circumference ÷ hip circumference.
An illustrative 80 cm waist and 100 cm hip measurement produce 80 ÷ 100 = 0.80. If both were measured in inches instead, consistent unit conversion would leave the ratio unchanged. Mixing an 80 cm waist with a 39.37-inch hip value would not.
The WHO expert consultation discusses measurement protocols and variation across populations. The ratio is a screening measure with context; it is not a complete assessment of health or a body-shape score.
Three examples that look similar at first
| Scenario | Waist | Hips | Ratio |
|---|---|---|---|
| Starting example | 80 cm | 100 cm | 0.800 |
| Waist smaller | 78 cm | 100 cm | 0.780 |
| Hips larger | 80 cm | 104 cm | 0.769 |
| Both smaller | 76 cm | 95 cm | 0.800 |
The second and third scenarios both lower the ratio, but only one reduces the waist. In the fourth scenario, both measurements fall by 5%, so the ratio stays exactly the same: 76 ÷ 95 = 0.80. An unchanged ratio therefore does not prove unchanged measurements.
These are hypothetical arithmetic examples. They do not identify the tissue responsible for any change or show that one scenario causes a particular health outcome. A ratio alone cannot make those distinctions.
A small measurement difference can move the ratio
Keep the waist at 80 cm. A hip measurement of 99 cm gives approximately 0.808, while 101 cm gives approximately 0.792. A two-centimetre difference in the recorded denominator creates a visible spread even though the waist entry is identical.
This does not establish a universal measurement error. It demonstrates why tape position, tension and a consistent protocol matter. If you are unsure how the measurements were obtained, it is better to repeat them carefully than interpret the third decimal place.
Keep a record that explains the change
Use columns for date, waist, hips, units, measurement method and calculated ratio. If the protocol changes, note it. For example, a measurement taken at a different waist landmark should not silently replace one taken using the earlier instructions.
For step-by-step measurement instructions, see how to measure waist-to-hip ratio. This article adds an interpretation check: after measuring, inspect the two original numbers before describing the result as an improvement or deterioration.
A useful comparison sequence
- Verify that both records use the same units and method.
- Compare the waist values directly.
- Compare the hip values directly.
- Recalculate the ratio from the unrounded measurements.
- Describe what changed without assigning a health conclusion from the ratio alone.
A clear description would be “waist unchanged; hip measurement four centimetres higher; calculated ratio lower.” That statement is more informative than “health improved by 0.03.” The latter assigns clinical meaning that the arithmetic has not established.
NHLBI describes the role of body-fat distribution in a wider assessment. If you are using waist measurements to understand personal risk, discuss them together with other health information. The calculator can verify division; it cannot determine why measurements changed or replace an individual clinical evaluation.
Sources and method
Sources checked September 18, 2026. Numerical examples are illustrative calculations, not patient or animal records.