 Skip to content
Sequence of returns risk is the risk that the order of investment gains and losses harms a portfolio while money is being withdrawn. Poor returns near the start of withdrawals can leave less capital available for a later recovery, even when the same set of returns looks acceptable as an average.
A fixed-return Retirement Calculator is useful for a baseline projection. It cannot turn a smooth assumed return into a guarantee, and a constant-rate projection alone does not test different market sequences.
A two-year example you can reproduce
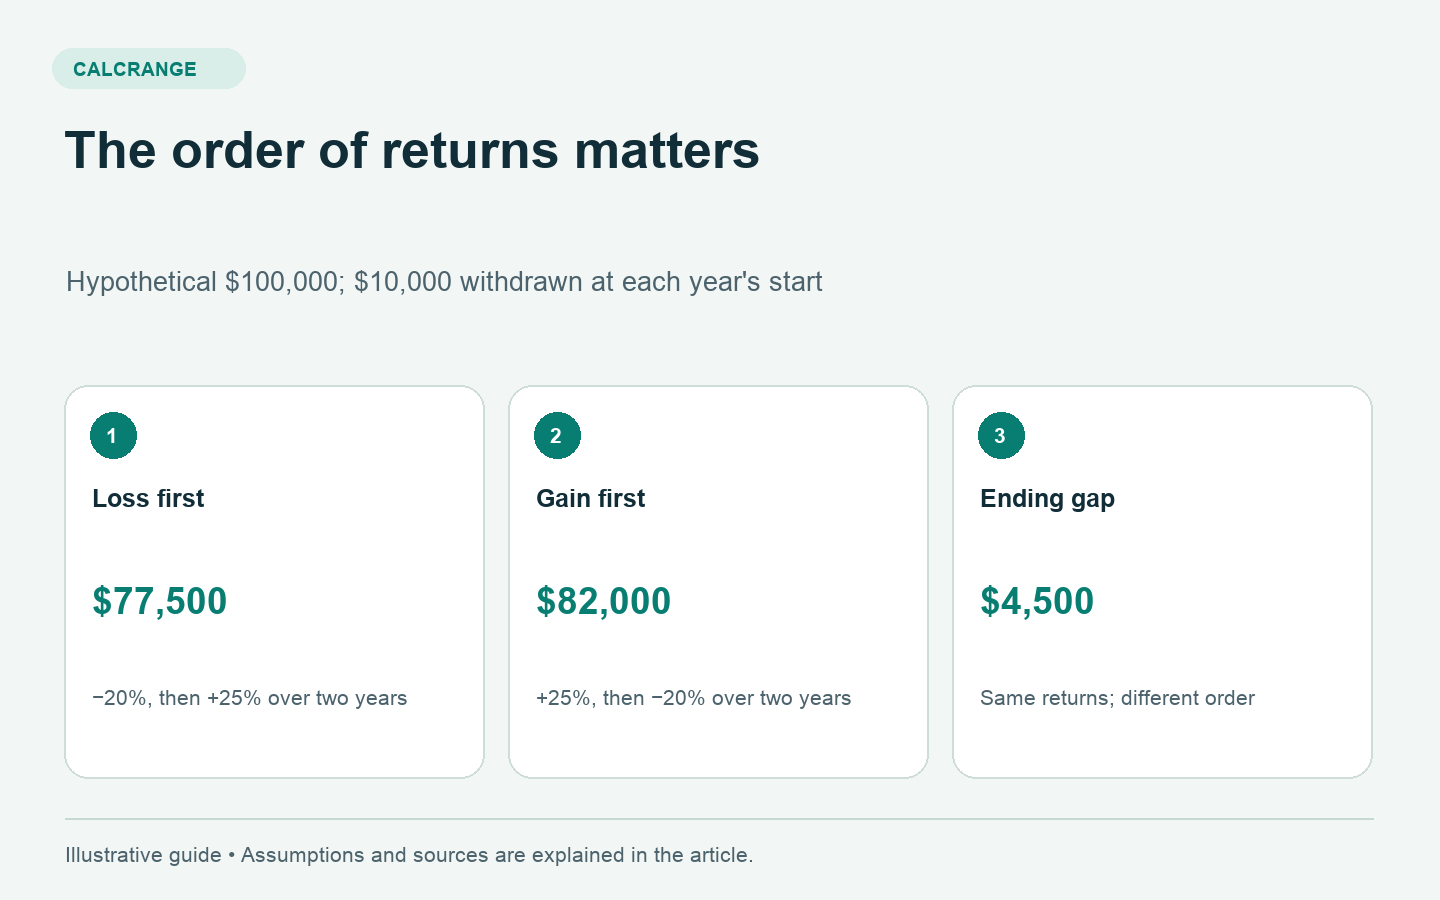
Start with $100,000. Withdraw $10,000 at the beginning of each year. The portfolio experiences one year returning −20% and one year returning +25%. There are no contributions, taxes, fees or inflation. These are invented teaching numbers, not market history or a recommended withdrawal rate.
| Step | Loss first | Gain first |
|---|---|---|
| Opening balance | $100,000 | $100,000 |
| After first withdrawal | $90,000 | $90,000 |
| After year-one return | $90,000 × 0.80 = $72,000 | $90,000 × 1.25 = $112,500 |
| After second withdrawal | $62,000 | $102,500 |
| After year-two return | $62,000 × 1.25 = $77,500 | $102,500 × 0.80 = $82,000 |
The gain-first sequence finishes with $4,500 more. Both portfolios funded $20,000 of withdrawals and experienced the same two percentage returns. The timing of the withdrawals relative to those returns created the difference.
Why the no-withdrawal result is different
Remove both withdrawals and the ending balance is $100,000 in either order: $100,000 × 0.80 × 1.25 = $100,000. Multiplication gives the same result when those factors are reversed.
With withdrawals, subtraction is inserted between the return factors. Reversing the returns no longer leaves the whole calculation unchanged. This is the mathematical reason a savings projection cannot always be read as a retirement-income projection.
Also notice that the arithmetic average of −20% and +25% is +2.5%, yet the no-withdrawal portfolio earned zero cumulatively across the two years. Applying a steady 2.5% for both years would misrepresent this example. Average returns need a clearly stated definition.
Specify when withdrawals happen
The table takes money out at the start of each year. A model that withdraws at year-end will produce different balances. Monthly withdrawals produce another pattern. Comparing calculators without aligning this convention can look like an error even when each follows its own assumptions consistently.
For a simple spreadsheet, use one row per year with opening balance, withdrawal, return and closing balance. Under the start-of-year convention, closing balance = (opening balance − withdrawal) × (1 + return). Carry that closing balance into the next row and stop the model if it cannot fund a withdrawal.
How to use a retirement projection responsibly
Schwab’s explanation of sequence risk discusses why the timing of poor returns can matter during withdrawals. The original two-year example here isolates that effect; it does not measure the probability of any retirement outcome.
Keep a baseline scenario, then ask how the plan would behave with lower early returns, a longer retirement or higher spending. A calculator with only one constant-return field can compare different steady assumptions, but it cannot reproduce a varying annual sequence unless that functionality is provided.
Keep other risks visible
FINRA’s risk overview describes investment risks including inflation and market losses. Avoid solving one risk in a worksheet by silently ignoring another. A cash balance, for example, should not be modeled as automatically preserving purchasing power indefinitely.
Document whether returns are before or after fees and whether spending is in current or future dollars. Record guaranteed or other income separately from portfolio withdrawals. These labels make it possible to see which part of the plan depends on investment performance.
No two-year example establishes a safe withdrawal percentage, ideal asset allocation or personal retirement date. For an actual plan, evaluate a broader range of scenarios and individual constraints with appropriately qualified advice. The value of this calculation is that it makes an important hidden assumption visible.
Sources and method
Source links checked September 18, 2026. Examples are original educational calculations using the assumptions stated above.