
Waist hip ratio measurement error can enter through either measurement. A slightly different tape position, tension or reading can move the quotient even when you are trying to repeat the same assessment. The Waist-to-Hip Ratio Calculator divides the values you enter; it cannot verify how the tape was placed.
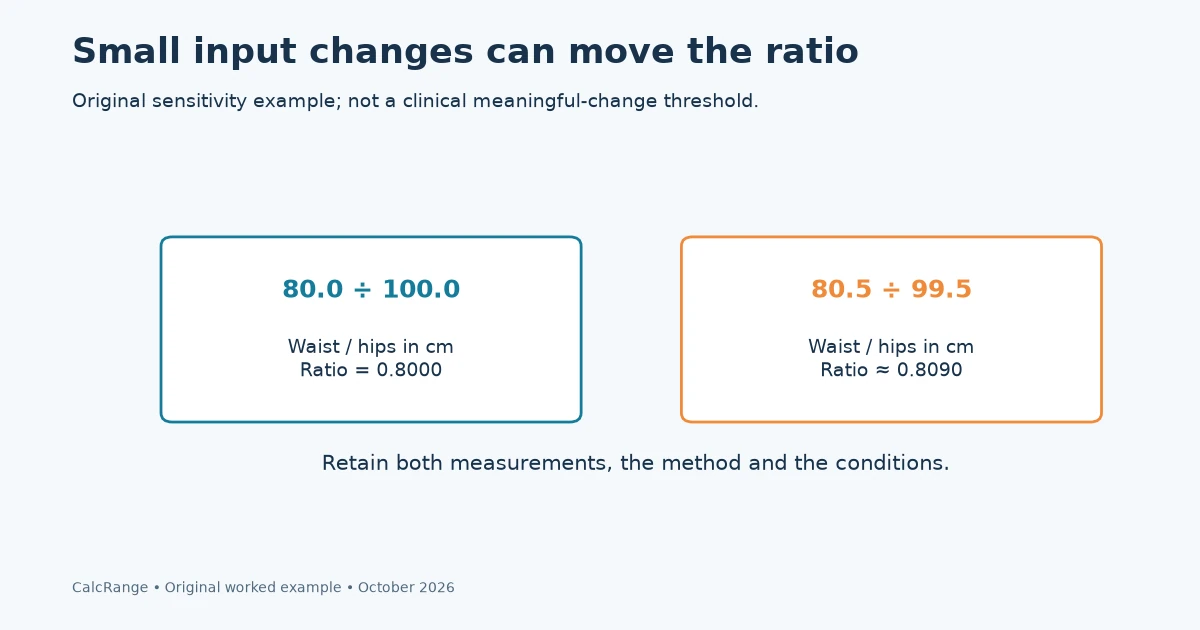
Table of Contents
Start a waist hip ratio record with repeatable inputs
The WHO expert consultation discusses measurement protocols as well as interpretation. For a useful repeat comparison, keep the landmark, tape method and conditions consistent. Do not change protocols halfway through a log without noting it.
The arithmetic is waist circumference divided by hip circumference, with both in the same unit. Because the denominator also matters, a small change in the hip reading can alter the ratio even if the waist reading stays fixed.
| Waist | Hips | Ratio before rounding |
|---|---|---|
| 80.0 cm | 100.0 cm | 0.8000 |
| 80.5 cm | 100.0 cm | 0.8050 |
| 80.0 cm | 99.5 cm | 0.8040 |
| 80.5 cm | 99.5 cm | 0.8090 |
These are deliberately chosen arithmetic variations, not a measured error distribution or a claim that everyone’s tape measurements vary by 0.5 cm. The table shows why both original measurements should be retained.
An original repeated waist hip ratio record
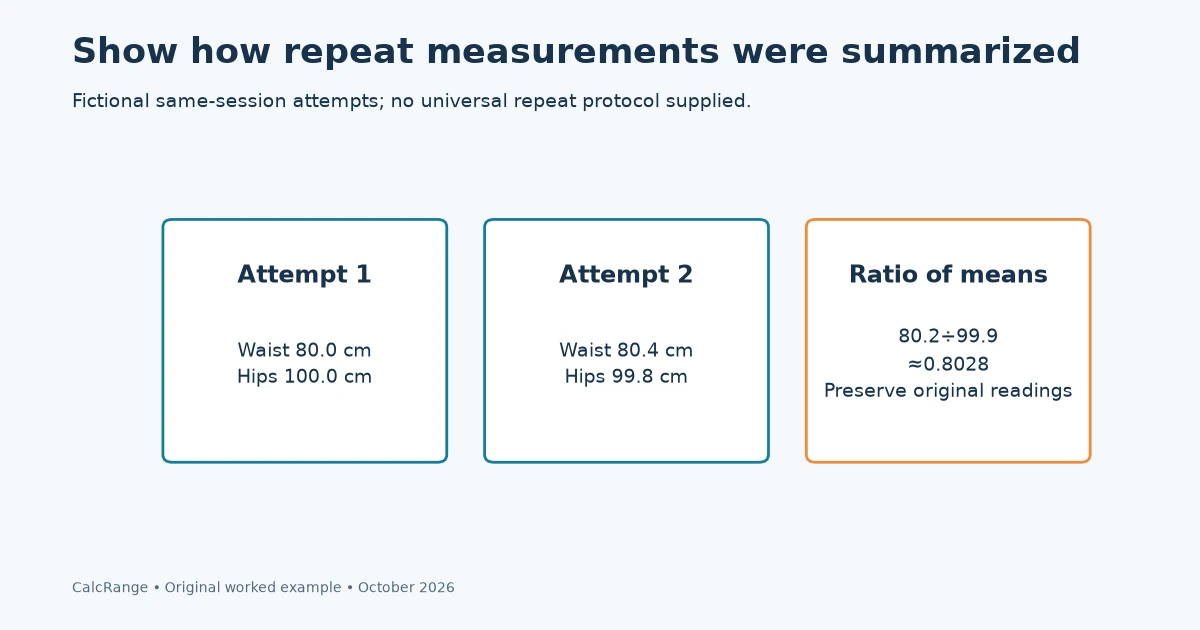
Imagine two attempts during one session, after resetting the tape between them. This example does not establish a universal rule for how many readings to take or when a difference is acceptable.
| Attempt | Waist | Hips | Calculated ratio |
|---|---|---|---|
| 1 | 80.0 cm | 100.0 cm | 0.8000 |
| 2 | 80.4 cm | 99.8 cm | 0.8056 |
The waist differs by 0.4 cm, the hips by 0.2 cm and the ratio by about 0.0056. Before interpreting that as biological change, review the measurement method: these were attempts in the same session, not evidence of a change over weeks.
If following a research or clinical protocol, use its repeat and averaging rules. Do not invent a rule to keep only the lowest waist or highest hip measurement, since that systematically lowers the ratio.
If you record a summary, preserve the individual readings too. Averages of circumferences and averages of calculated ratios are related but not mathematically identical in general. State which procedure was used.
Use consistent landmarks for waist hip ratio
WHO’s reference describes waist measurement at the midpoint between the lower margin of the last palpable rib and the top of the iliac crest, and hip measurement around the widest part of the buttocks. Keep the tape horizontal and avoid compressing the skin; follow the chosen protocol’s breathing and posture instructions.
Some other tools or circumference equations use a waist measurement at the navel. That is a different landmark. A number taken for the body-fat calculator should not automatically be treated as a measurement under the waist-to-hip protocol.
The measurement guide covers the setup. This article focuses on documenting repeatability after the setup is chosen.
Record any change in measurer, tape, clothing or landmark. A home log cannot separate every source of error, but it can keep obvious changes from being mistaken for a trend.
Check waist hip ratio units and display rounding
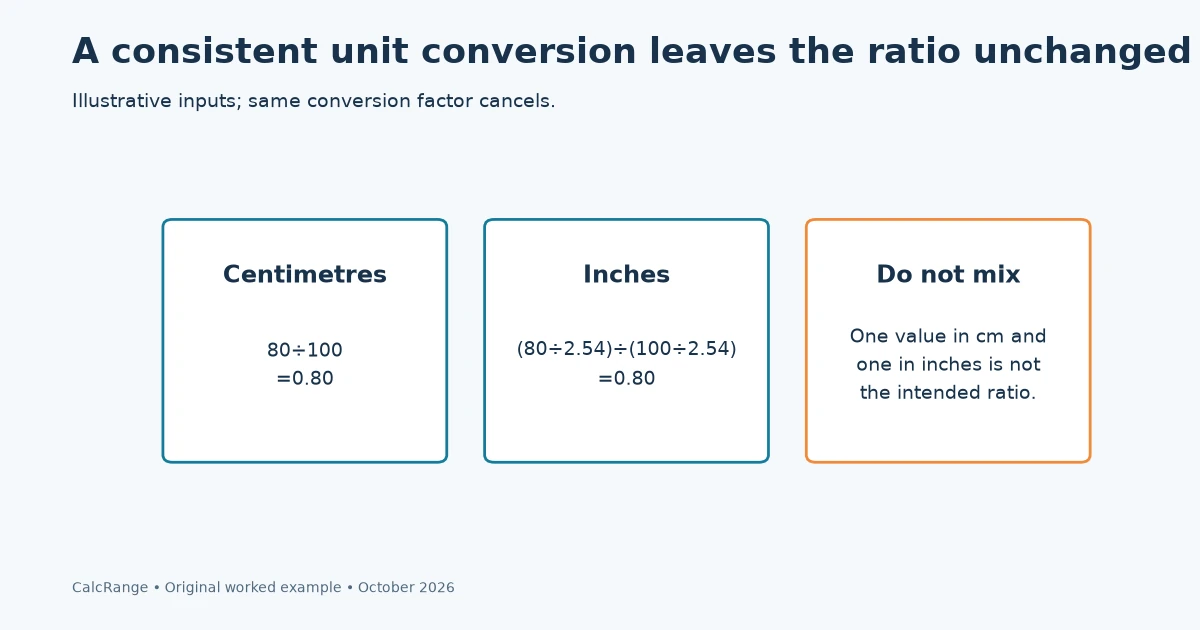
Using centimetres for both measurements or inches for both gives the same ratio apart from rounding. Mixing centimetres and inches does not. Entering 80 cm as the numerator and approximately 39.37 inches as the denominator creates an invalid mixed-unit quotient.
Keep the unrounded measurements until the division is complete. Rounding a result to two decimal places can make different calculations look identical or place nearby values on opposite display steps.
For example, 0.8000 and 0.8040 can both display as 0.80 at two decimals. That does not mean their original inputs were identical. Conversely, a display changing from 0.80 to 0.81 is not proof of a clinically meaningful change.
The calculator’s decimal places are a display choice. They do not establish the smallest real-world change the measurement process can detect.
Report a waist hip ratio observation without overstating it
A useful comparison includes both circumferences, their dates, the method and the ratio. The article on why a lower ratio can mislead examines changes in the numerator and denominator over time; this worksheet instead checks whether the measurements were repeatable in the first place.
No universal minimum clinically important difference is supplied here. A small ratio movement cannot establish an improvement or deterioration in health on its own. Screening references require appropriate context, and an individual concern belongs with a healthcare professional.
You can accurately write, “The second tape attempt produced a ratio 0.0056 higher, with a different waist and hip reading.” Claiming that health risk changed by a corresponding percentage would go beyond the evidence.
Check unit invariance with one pair of measurements
Use an illustrative waist of 80 cm and hips of 100 cm. Dividing both by 2.54 gives approximately 31.4961 inches and 39.3701 inches. Their ratio remains 0.80 when enough precision is retained.
This works because the same conversion factor appears in numerator and denominator and cancels. Converting only the waist or only the hips leaves a mixed-unit calculation that no longer describes the intended ratio.
| Waist | Hips | Ratio |
|---|---|---|
| 80 cm | 100 cm | 0.8000 |
| 80 ÷ 2.54 in | 100 ÷ 2.54 in | 0.8000 |
| 80 cm | 39.3701 in | Invalid mixed-unit comparison |
If you start from rounded inch values, allow for a small rounding difference rather than assuming that the mathematical definition changed. Keep the original tape readings in their original unit and convert only as needed.
A unit-invariant ratio is still only as reliable as its measurements. This check can identify a unit error, but it cannot establish that the tape landmark, posture or tension was correct.
Keep repeat summaries transparent
Using the two fictional attempts above, the average waist is (80.0 + 80.4) ÷ 2 = 80.2 cm and the average hips are (100.0 + 99.8) ÷ 2 = 99.9 cm. Dividing those means gives approximately 0.8028.
Averaging the two separately calculated ratios also gives about 0.8028 when shown to four decimals, but the unrounded values differ slightly. Do not generalize this near-agreement into a rule that the two procedures always produce an identical result.
If a specified clinical or research method says how to repeat, reject or average readings, follow it. This arithmetic example does not replace that protocol. A household worksheet should state its method rather than selecting whichever summary gives the preferred result.
Record whether readings were taken in one session or on different dates. Two repeats intended to assess measurement consistency answer a different question from two measurements months apart.
Keep a note of corrections. A number changed because of a misplaced decimal point should not be plotted as if it were a newly observed body change.
Write a comparison note that preserves both components
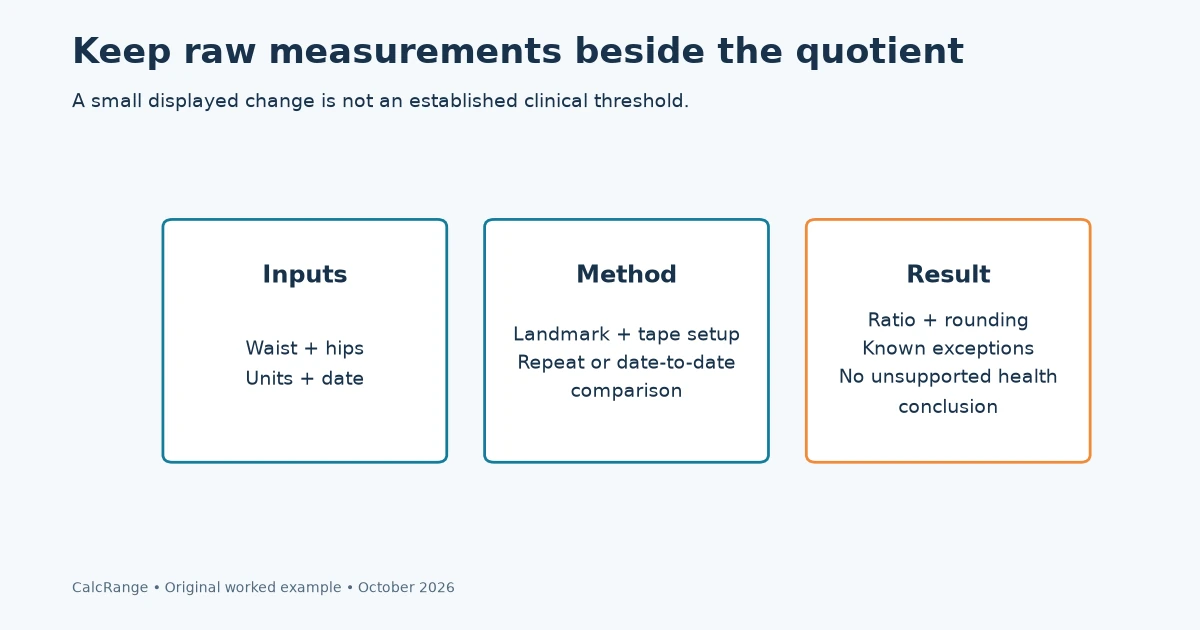
A ratio-only log can conceal the source of a change. Use a note with the waist, hips, date, units and protocol before adding the quotient. If either component was measured differently, state that explicitly.
For example: “Attempt 1: 80.0/100.0 cm; attempt 2: 80.4/99.8 cm; same session; tape reset between attempts.” This accurately records the inputs without claiming that an underlying health characteristic changed during the session.
Do not attach a universal acceptable-error band to the example. Establishing measurement reliability requires a defined procedure and suitable evidence. The chosen 0.4 cm and 0.2 cm differences are teaching inputs, not published normal limits.
A threshold shown by a calculator is a screening reference, not proof that a tiny difference crossing the displayed boundary represents a sudden clinical transition. Discuss individual concerns with a qualified healthcare professional rather than making a treatment decision from a rounded quotient.
For progress tracking, retain the raw measurements and the reasons for any method changes. The resulting record may be less visually tidy than a single smooth line, but it is easier to audit and less likely to turn measurement variation into an unsupported story.
Only after the recording method is clear should the ratio be compared across dates. The calculator performs the division; the record explains what the divided values actually represent.
Waist hip ratio measurement questions
Does a change of 0.01 prove a health change?
No. This worksheet establishes no universal meaningful-change threshold. Review measurement consistency and individual context before interpreting a small difference.
Can I use inches for the ratio?
Yes, if both waist and hip measurements use inches. The units cancel; mixing inches and centimetres is incorrect.
Should I keep only the smallest waist reading?
No. Follow the chosen measurement protocol and preserve the readings. Selecting the most favorable value biases the record.
Sources and calculation notes
All repeated readings are fictional arithmetic examples, not measured variability or a clinical threshold. The tool does not validate tape placement. Sources checked October 30, 2026.