
A body fat scale and a tape-measure calculator can return different percentages from the same person on the same day. Keep separate records for each method instead of averaging them into a supposedly more accurate result. The Body Fat Calculator estimates from body measurements; it does not read the electrical measurement used by a consumer body-composition scale.
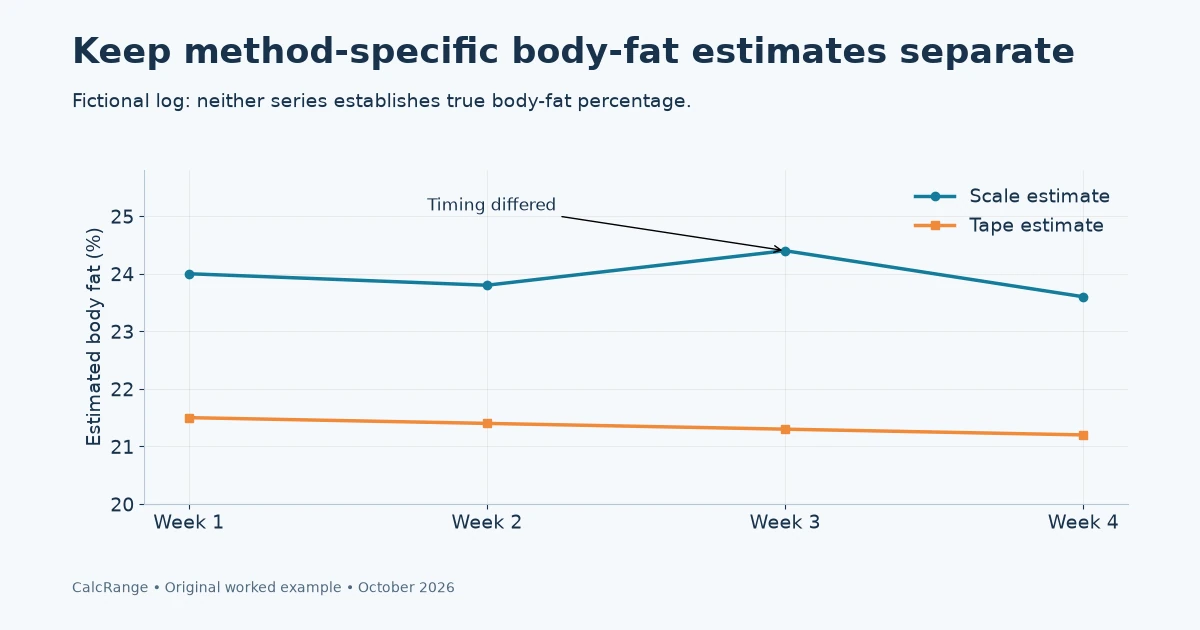
Table of Contents
Body fat scale vs tape measure: what changes
A bioelectrical impedance scale combines an electrical measurement with an estimation model. A circumference equation combines tape measurements with its own model. Neither number is a direct count of every gram of fat.
A 2021 study of three consumer smart scales compared their outputs with DXA and found limitations in body-composition agreement. Its findings apply to the tested devices and sample; they do not justify one universal error percentage for every scale or every person.
| Record | Scale estimate | Tape-based estimate |
|---|---|---|
| Method name | Device model and mode | Named circumference equation |
| Inputs | Device settings and conditions | Original circumferences, height and units |
| Output | Estimated body-fat percentage | Estimated body-fat percentage |
| Comparison rule | Compare with the same device over time | Compare with the same protocol and equation |
Changing the scale’s mode or replacing the device can create a break in the series. Changing where the tape is placed can do the same. Record the change rather than drawing one continuous line that hides it.
Body fat scale and tape: an original two-method log
The following invented measurements illustrate record keeping. They are not study results, a target body-fat range or an expected pace of change.
| Date | Scale estimate | Tape estimate | Condition note |
|---|---|---|---|
| Week 1 | 24.0% | 21.5% | Usual recorded setup |
| Week 2 | 23.8% | 21.4% | Same setup |
| Week 3 | 24.4% | 21.3% | Scale timing differed |
| Week 4 | 23.6% | 21.2% | Usual setup restored |
The scale changes from 24.0% to 23.6%, a decrease of 0.4 percentage points. The tape estimate changes from 21.5% to 21.2%, a decrease of 0.3 percentage points. These are changes in recorded estimates; they do not prove that the true body-fat percentage moved by either amount.
Do not subtract the two methods and call the 2.5-point first-week gap the scale’s “error.” Without an appropriate reference assessment, you cannot identify which estimate is closer to the underlying quantity. Averaging 24.0% and 21.5% to 22.75% does not resolve that uncertainty.
Keep body fat scale recording conditions repeatable
Follow the device manufacturer’s instructions for use and contraindications. Record a consistent time and relevant conditions rather than changing your drinking, exercise or eating simply to force a preferred reading.
For the tape method, use the measurement sites required by that equation. The current calculator labels the waist site at the navel, neck circumference and, where applicable, hip circumference. A waist-to-hip screening protocol may use a different waist landmark; do not substitute it silently.
Keep the tape level and avoid compressing tissue. If a reading seems implausible, recheck the placement and units before saving it. Our circumference-method guide covers the tool’s inputs.
Save the original measurements alongside the calculated percentage. If the output changes unexpectedly, this lets you identify whether the neck, waist, hip or height entry changed. A percentage alone loses that audit trail.
Body fat scale repeatability is different from accuracy
A device can produce similar readings repeatedly and still differ from a reference method. Conversely, a fluctuating reading may reflect conditions, measurement noise or a real change; a household log cannot automatically distinguish them.
A study of fifteen consumer bioimpedance devices evaluated both repeatability and comparison with a four-compartment model. These are separate questions, which is why consistency alone should not be described as proof of accuracy.
When a trend changes, first check the record: same device, same mode, same equation, same units and same measurement landmarks. A new phone app or firmware version is worth noting. Do not delete an inconvenient reading without preserving the reason.
There is no universal minimum meaningful change supplied by this worksheet. A 0.1-point display step is not a guarantee that a 0.1-point biological change can be detected. Avoid treating the last digit as a medical finding.
Use the log to ask a better question
If you need an individual assessment for a health or treatment decision, take the log to an appropriately qualified professional. Describe the methods and conditions rather than asking them to interpret an unlabeled number.
Keep weight, body-fat estimate and estimated fat mass separate. The percentage-versus-fat-mass guide explains the multiplication, but converting a percentage into kilograms carries forward its uncertainty.
A useful record can simply state: “The tape estimate declined across four similarly recorded sessions; the scale had one timing exception.” That is more faithful to the observations than claiming that a precise amount of fat was lost or that one method must be faulty.
Distinguish percentage points from relative percent change
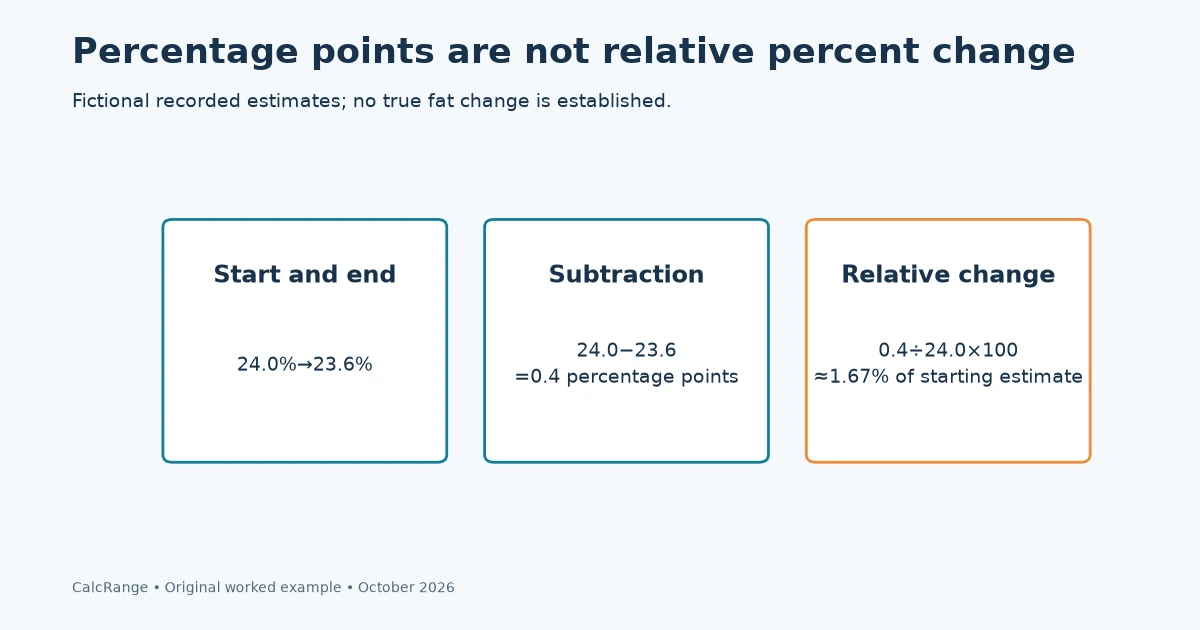
The fictional scale log falls from 24.0% to 23.6%. Subtracting gives a decline of 0.4 percentage points. Dividing that change by the starting estimate gives 0.4 ÷ 24.0 × 100, approximately 1.67% relative to the starting estimate.
Both calculations describe the recorded estimates, but they are not interchangeable labels. Saying “down 1.67 percentage points” would overstate the subtraction. Neither calculation establishes the amount of actual fat lost.
| Calculation | Value | Correct label |
|---|---|---|
| 24.0 − 23.6 | 0.4 | Percentage-point decrease |
| (24.0 − 23.6) ÷ 24.0 × 100 | About 1.67% | Relative decrease in the estimate |
Use the absolute percentage-point difference in a simple tracking log, and state a relative calculation explicitly if you need one. Keep the original percentages beside it so another reader can check which denominator you used.
A display rounded to one decimal place also hides smaller differences. The apparent 0.4-point movement should not be interpreted as an exact biological change just because its arithmetic is simple.
See how method disagreement carries into estimated fat mass
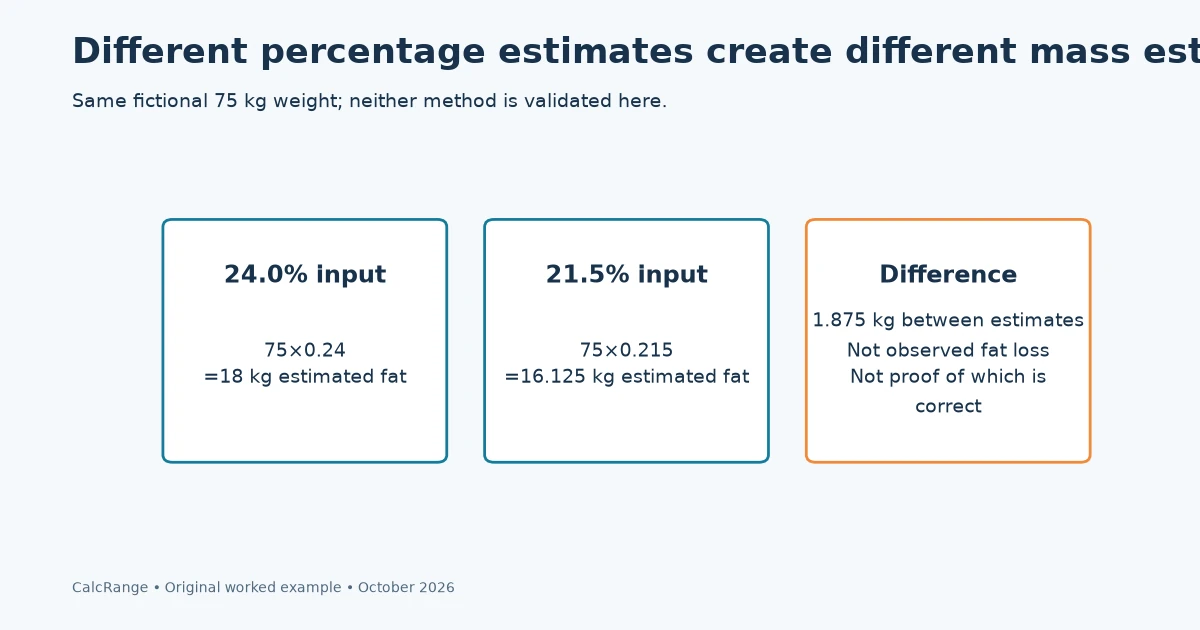
Suppose both methods are applied to a fictional 75 kg body-weight entry. A 24.0% estimate corresponds to 75 × 0.24 = 18 kg estimated fat mass. A 21.5% estimate corresponds to 75 × 0.215 = 16.125 kg.
The 1.875 kg difference between those derived values comes entirely from the percentage inputs in this example. It is not evidence that the person gained or lost that amount between measurements, and it does not identify which method is closer to a suitable reference assessment.
Multiplying an uncertain percentage by a carefully measured weight does not remove uncertainty from the result. If you report estimated fat mass, name the body-fat method and the weight record used in the multiplication.
Do not subtract a scale estimate on one date from a tape estimate on another and call the result a continuous change. You have changed both date and method. Keep a separate baseline for each method if both are being followed.
The same caution applies to a device’s “muscle” or other derived output: its label, model and measurement basis matter. This worksheet does not validate additional proprietary estimates.
Document a method change instead of stitching the lines together
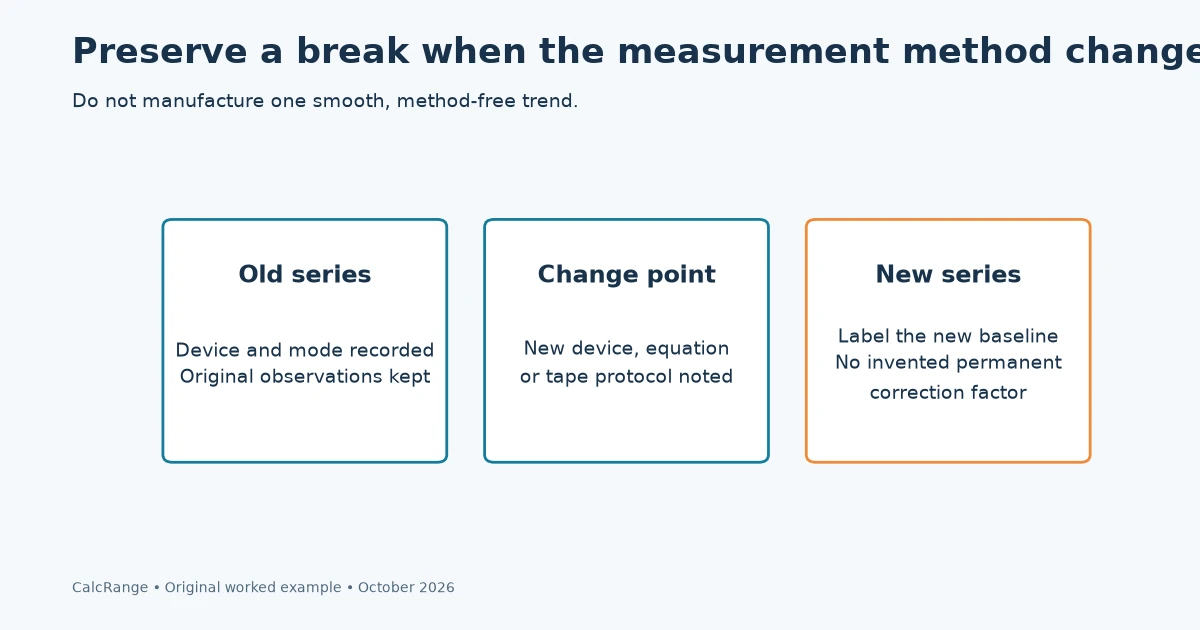
If a scale is replaced, retain the old series and start a clearly labelled new one. If circumstances allow a comparison under the manufacturers’ instructions, it may reveal a gap between outputs, but it does not establish a permanent correction factor.
A constant adjustment such as “subtract 2.5 points from this scale” would assume that the first observed disagreement stays fixed across time and body composition. The example does not provide evidence for that assumption.
For the tape series, keep the measurement equation and landmark instructions with the record. A new calculator can use a different circumference equation even when its page title also says “body fat.” Review the documented method before appending its result to the old log.
If an entry is missing, leave a visible gap. Drawing a line across it is a visual connection, not an observation of what happened during that interval. Do not fill the gap with a value chosen to make the trend smooth.
A useful final report names the method, period, number of recorded sessions and known exceptions. It can describe the observed direction without claiming precision, a diagnosis or a target that the measurements do not support.
Body fat scale comparisons: common questions
Should I average the two body-fat percentages?
An average does not make incompatible estimates more accurate. Keep method-specific records and report their disagreement openly.
Is a stable scale reading proof of accuracy?
No. Repeatability and agreement with a suitable reference assessment are different properties.
Can a small weekly change prove fat loss?
Not by itself. Measurement conditions, model uncertainty and actual body changes can all affect the estimate; no universal meaningful-change threshold is established here.
Sources and calculation notes
- Frija-Masson et al.: accuracy of three smart scales compared with DXA
- Consumer bioimpedance devices: repeatability and agreement study
The four-week table is invented solely to demonstrate logging and percentage-point arithmetic. No device-specific accuracy claim or individual body-fat target is inferred. Sources checked October 30, 2026.