
Protein per serving and protein per 100 g use different denominators. To calculate the protein in a portion, multiply the stated protein by the portion’s size divided by the label’s reference size. The Protein Requirement Calculator estimates a daily range; it does not read a food label or automatically total your meals.
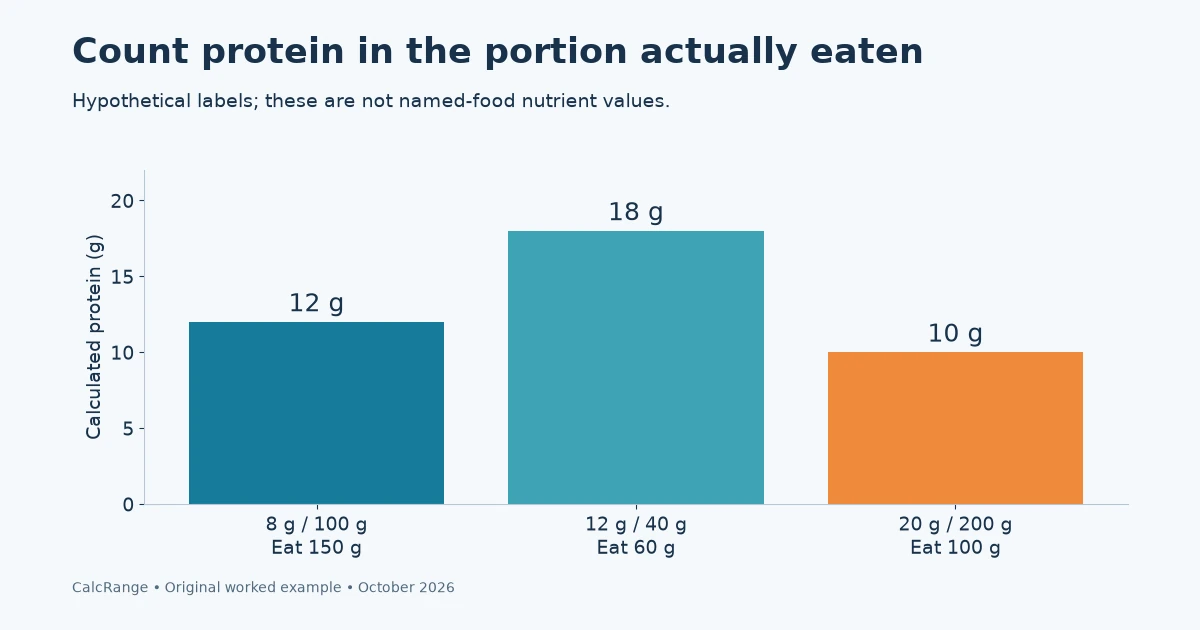
Table of Contents
Protein per serving vs per 100g: read the basis first
The FDA label guide explains that nutrition information is tied to the stated serving. A serving size on a label is not, by itself, a recommendation for how much you personally should eat.
Before multiplying, record three things: protein in grams, the reference portion and the amount actually being counted. The reference may be a serving, 100 g, the whole package or a prepared quantity.
| Label basis | Portion being counted | Multiplier |
|---|---|---|
| Per 100 g | 150 g | 150 ÷ 100 = 1.5 |
| Per 40 g serving | 60 g | 60 ÷ 40 = 1.5 |
| Per whole 200 g container | Half the container | 0.5 |
The calculation assumes the food portion has the same composition as the label’s stated basis. It does not fix a mismatch between dry and cooked weights or a food that was drained when the label includes liquid.
Three original protein per serving calculations
These are hypothetical labels, not nutrient claims for named foods. Use the actual package or a suitable food-composition record for real planning.
| Example label | Amount counted | Calculation | Protein |
|---|---|---|---|
| 8 g protein per 100 g | 150 g | 8 × 150 ÷ 100 | 12 g |
| 12 g protein per 40 g serving | 60 g | 12 × 60 ÷ 40 | 18 g |
| 20 g protein per 200 g container | 100 g | 20 × 100 ÷ 200 | 10 g |
The three portions together contribute 12 + 18 + 10 = 40 g of protein under those assumptions. The portions’ total food mass is 150 + 60 + 100 = 310 g. Food mass and protein mass are different quantities.
In the second example, 60 g of food is 1.5 label servings. Multiplying the protein by 60 directly would give 720 g, an obvious denominator error. The units help: grams of food divided by grams of food cancel, leaving a serving multiplier.
Keep enough precision during calculation, then round the result sensibly. Label values are already rounded, so reporting many decimal places does not create a precise chemical analysis.
Convert protein per serving to a shared comparison basis
Suppose Product A’s hypothetical label says 10 g protein per 50 g serving, while Product B says 14 g per 100 g. Comparing 10 with 14 directly makes B look higher, but the serving sizes differ.
A converts to 10 ÷ 50 × 100 = 20 g per 100 g. B remains 14 g per 100 g. A has more protein per equal food mass in this example. That does not automatically make it the preferable food for an individual.
Price, other nutrients, allergies, preferences and the portion actually eaten are separate considerations. A per-100-g comparison standardizes the denominator; it does not score a complete diet.
If the label gives values per 100 mL, use a volume portion on the same basis. Do not assume every liquid has a mass of exactly 1 g per mL. Use documented density or the package’s equivalent mass if a mass conversion is necessary.
Keep raw, cooked and drained entries separate
Water gained or lost during preparation changes food mass. A protein figure per 100 g of dry food cannot simply be applied to 100 g of the cooked food. Match the state described by the label or database entry.
For a batch, you can calculate protein from its ingredients and then allocate that estimated total by the fraction of the finished batch eaten, if the batch is adequately mixed and no relevant ingredients are discarded. Record the assumptions.
For example, an illustrative batch contains 80 g total protein and weighs 1,000 g after preparation. A uniformly representative 250 g portion is one quarter of the batch and contains an estimated 20 g protein. The calculation is conditional; it is not a guarantee for a dish with unevenly distributed ingredients.
For drained foods, check whether the label refers to drained weight or the product as sold. Keep the discarded liquid separate rather than silently counting its weight as food eaten.
Connect protein per serving to a daily record
Make a meal log with one row per food, its label basis, the portion eaten and calculated protein. Sum the protein column once. Avoid counting both an ingredient and an imported complete-meal entry that already includes it.
Only after checking the food arithmetic should you compare it with an individually appropriate daily plan. A calculator range is not a prescription for pregnancy, illness or a protein-restricted diet. Follow relevant professional advice.
The food chart supplies broad comparison context, while daily protein reference calculations concern a separate denominator: body weight per day. Keep g per 100 g of food distinct from g per kg of body weight.
Convert protein per serving back to per 100 g
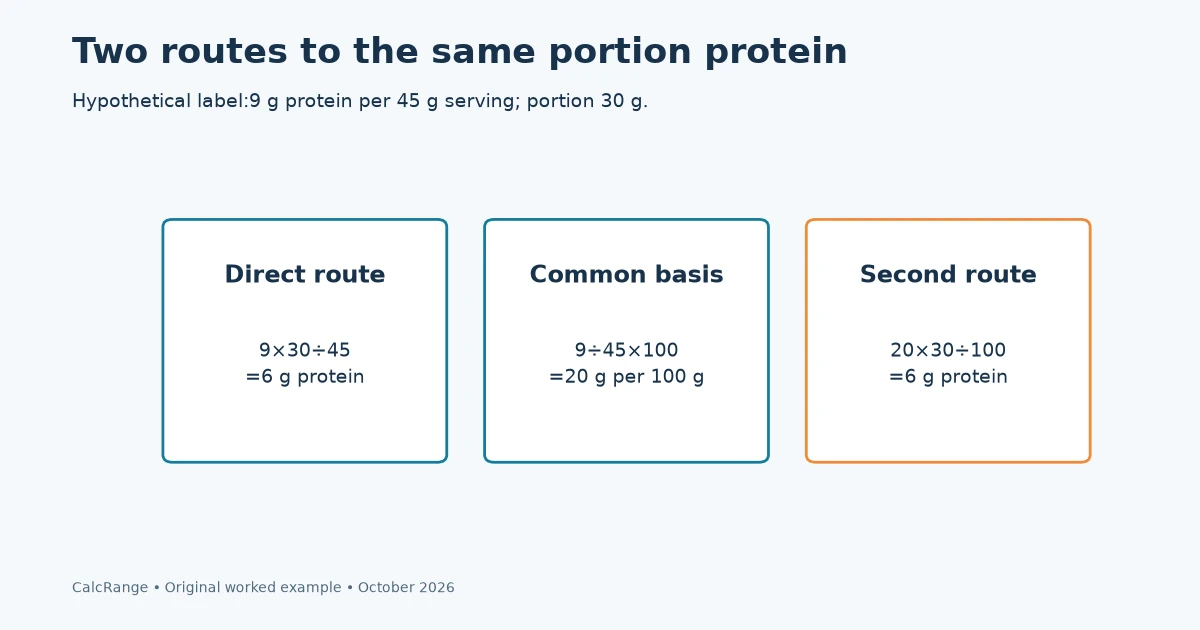
A per-serving label can be converted to a common comparison basis by dividing protein by serving mass and multiplying by 100. If a hypothetical 45 g serving contains 9 g protein, then 9 ÷ 45 × 100 = 20 g protein per 100 g.
For a 30 g portion of that same product, the estimate is 9 × 30 ÷ 45 = 6 g. You can check it using the converted basis: 20 × 30 ÷ 100 also gives 6 g.
| Route | Calculation | Result |
|---|---|---|
| Directly from serving label | 9 × 30 ÷ 45 | 6 g protein |
| Convert first to per 100 g | 9 ÷ 45 × 100 | 20 g per 100 g |
| Apply the converted basis | 20 × 30 ÷ 100 | 6 g protein |
The two routes should agree before rounding. If they do not, look for a different portion size, a missed factor of 100 or a copied value from another product.
This check standardizes arithmetic, not nutritional suitability. A food with a higher percentage of protein is not automatically the right choice for every meal or individual.
Reconcile portions with a package total
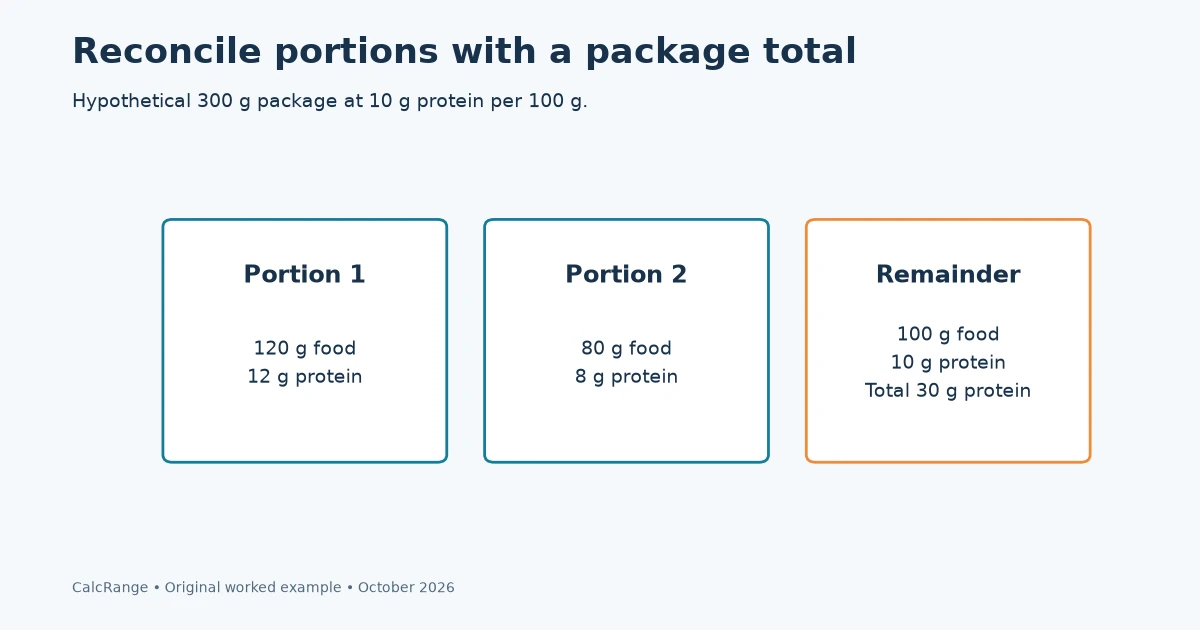
Suppose a hypothetical 300 g package provides 10 g protein per 100 g. The complete package contains an estimated 30 g protein on that basis. Portions of 120 g and 80 g contribute 12 g and 8 g, leaving 100 g of product and an estimated 10 g protein unallocated.
The portion masses should reconcile: 120 + 80 + 100 = 300 g. The estimated protein should reconcile too: 12 + 8 + 10 = 30 g. This is a useful way to catch a duplicated portion in a meal log.
If some food is discarded, keep it in a discarded or remaining category rather than counting it as eaten. For a mixed product, proportional allocation assumes each portion is representative; a portion containing most of one ingredient may not match the package average exactly.
Keep product weight and protein weight in differently labelled columns. A 100 g remainder is not 100 g protein. The denominator remains food mass, and the numerator remains the nutrient amount stated by the label.
For a package whose nutrition panel is based on a drained or prepared quantity, perform this reconciliation on that same basis. A package’s net weight alone does not establish the correct denominator for every nutrition panel.
Troubleshoot an implausible protein per serving result
If a calculation claims more grams of protein than the total mass of food counted, first check the multiplier and units. That can expose a simple denominator error, such as multiplying a per-serving value by grams without dividing by serving size.
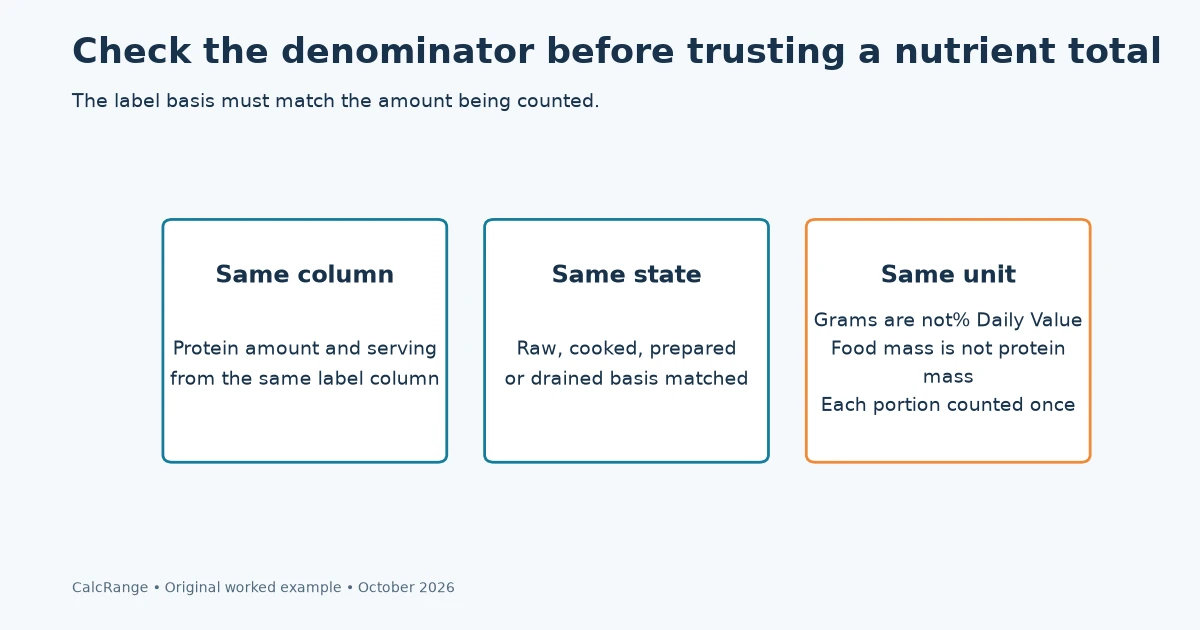
Check whether the label has both per-serving and per-package columns. Copy the protein value and the portion basis from the same column. A whole-container protein value combined with one serving’s mass can inflate the estimate.
Also distinguish grams from a percentage Daily Value where one is displayed. A percentage is not a protein mass that can be added directly to the gram totals from other foods.
When comparing entries from a food chart, keep the food description and preparation state with the number. A plausible amount does not prove that the database item matches what was eaten.
For a final daily record, sum each actual portion once and retain the calculation basis. If a professional has supplied a protein plan, use that plan’s definitions and limits. The worksheet helps count food amounts; it does not decide whether an individual should increase protein, use supplements or follow a restriction.
A clear result therefore includes the food portion, source label and estimated protein in grams, with uncertainties noted. That is more useful than an isolated total with no way to reconstruct it.
Protein per serving questions
Does a 30 g scoop contain 30 g of protein?
Not necessarily. Thirty grams may be the total product mass. Use the protein amount stated for that scoop or serving.
Can I compare protein grams from different serving sizes?
Convert both to the same food mass or the actual portions being compared first. Otherwise the denominators differ.
Can I apply a dry-food value to the same cooked weight?
Not without an appropriate conversion. Match the label or database entry to the food’s preparation state.
Sources and calculation notes
All label values and batch quantities are original hypothetical examples. No named product’s composition or individual protein requirement is asserted. Sources checked October 30, 2026.